Project Overview
Time Frame: 13 Weeks
Team Members: Eden Gorton, Harrison Khannah, Khaveer Narsai (Research Stage), Eden Gorton (Design Stage)
Tools: Adobe InDesign, Adobe XD, Adobe After Effects, Trello
My Role
User Research
I collaborated with my team with the creation of a research plan and conducted one of the several user research workshops with our potential stakeholders at the beginning of the design process. I also assisted with collating the findings into our Trello Boards for statement cards.
Rapid Prototyping
I experimented with and storyboarded a variety of ideas, each intended to investigate how we could improve the sociability of the whole Vivid experience.
UX DesignI was responsible for the creation of a variety of assets, such as that featured in our sensitising booklets and that seen in the user journey map featured below (as well as creating the journey map itself).
Project Brief
“For a museum, theatre or festival in Sydney design a digital/tangible/spatial experience that builds upon the content they offer (e.g. performances, collections). It should improve the visitor experience and help the institution to engage with new audiences, or affirm their relationship with existing ones. The experience should be closely interwoven with the context; it could not exist without that environment.”
Introduction
For this project, we were tasked with digitally revolutionising the experience of going to the theatre, the museum or a festival. As a group, we selected the Vivid Festival of Light in Sydney. While this festival already has a strong attendance and digital atmosphere, we felt that there was an opportunity to improve the visitor experience in terms of how it can connect individuals together.
Research Process
To understand the current Vivid experience, we conducted an ethnographic study and created a booklet of cultural probes/sensitising exercises in order to investigate the current views on how Vivid is perceived.
We organised for a group of research participants between 18-25 years old (to represent our target demographic) to complete these exercises over a 5 day span, followed by an in-person generative session, where we gave our participants two different cognitive mapping activities.
We conducted a total of 3 different sessions, with a collective total of 12 participants (4 participants in each session).
The objective of this process was to gain a deeper knowledge of our target market and branching away from surface layer questioning. As we cognitive mapped our target market's emotive responses to social and environmental situations, we understood their latent needs and found the problem to solve, beginning with the pain points towards festivals.
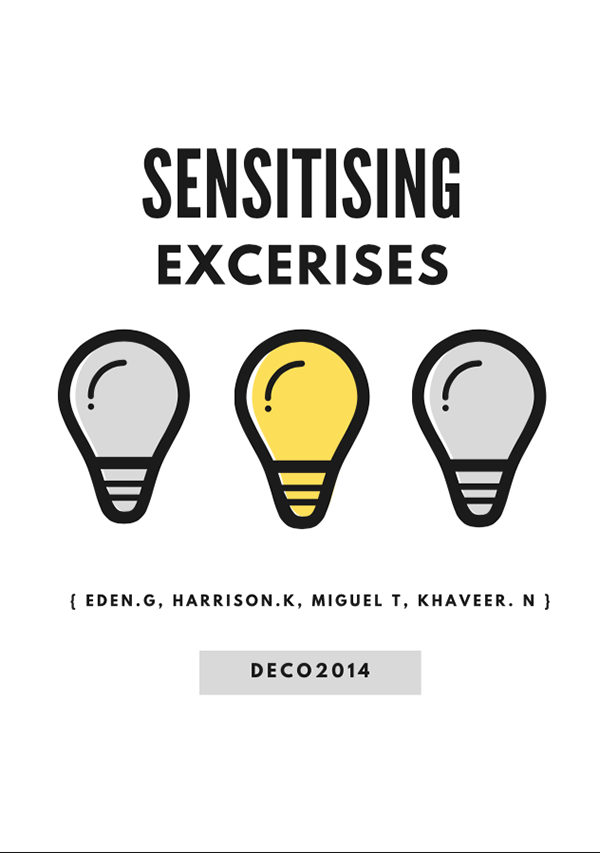
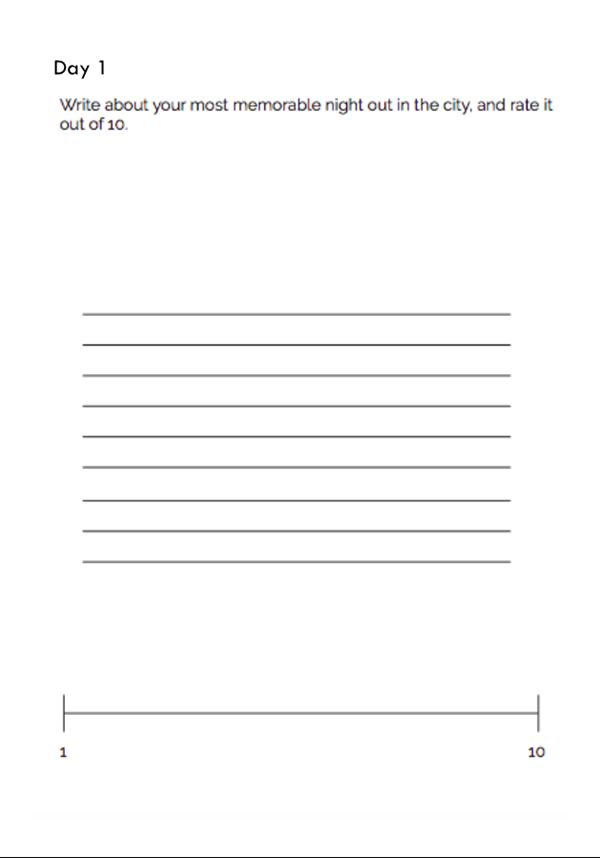
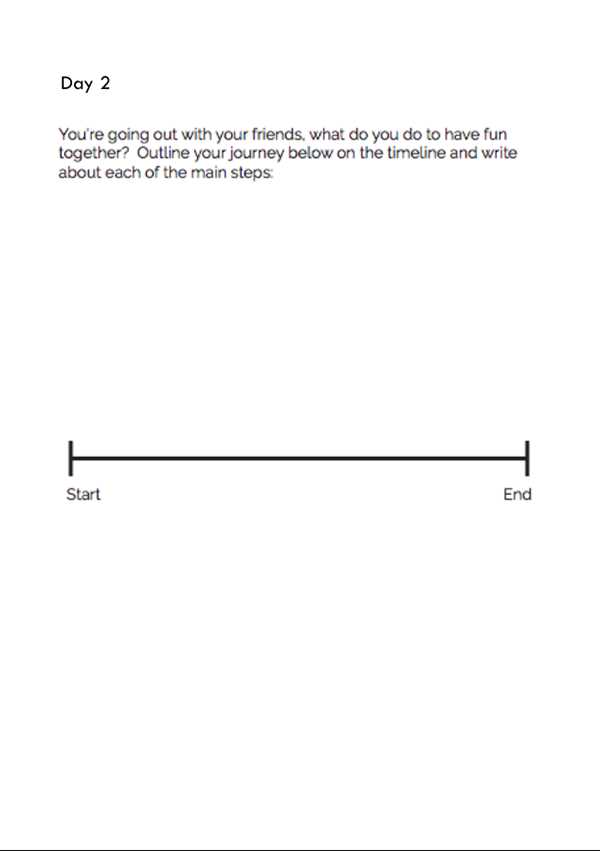
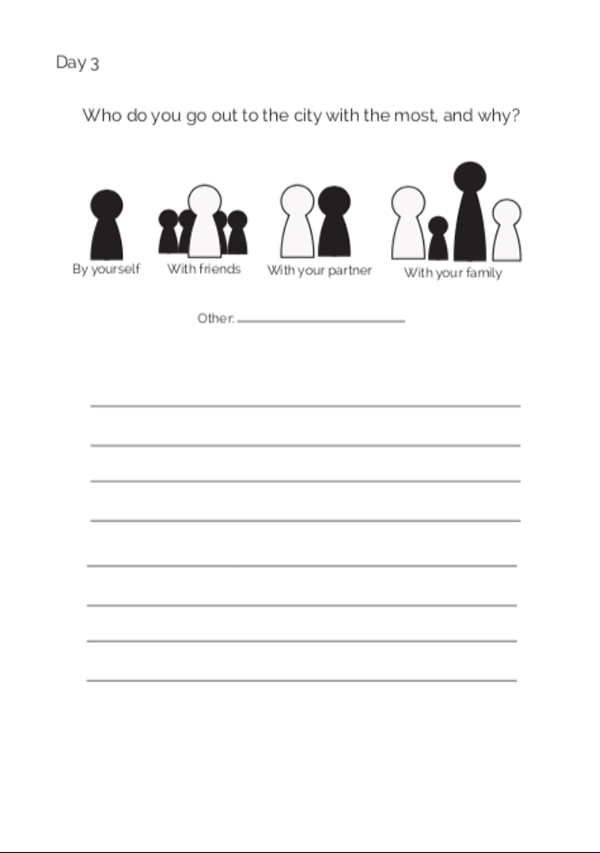
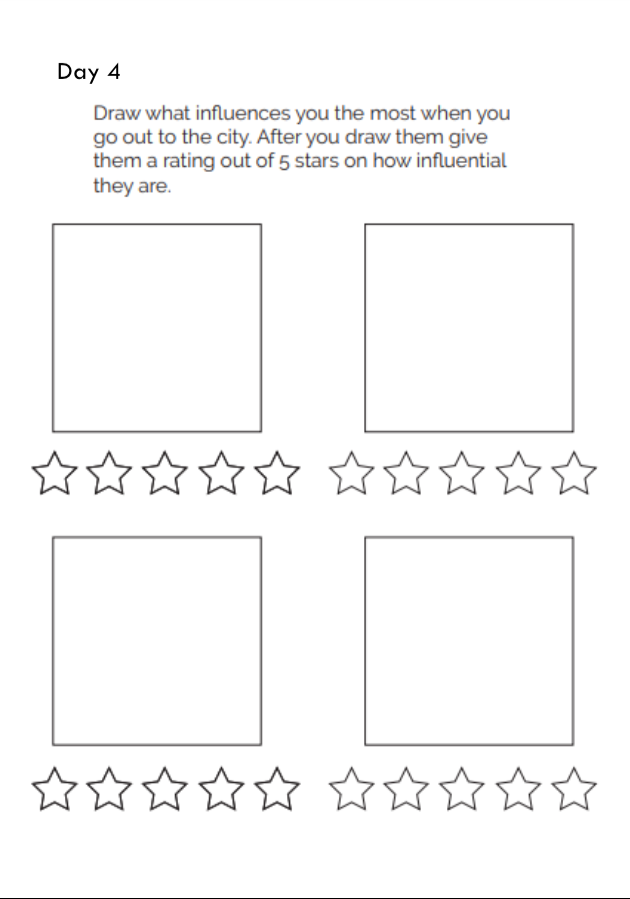
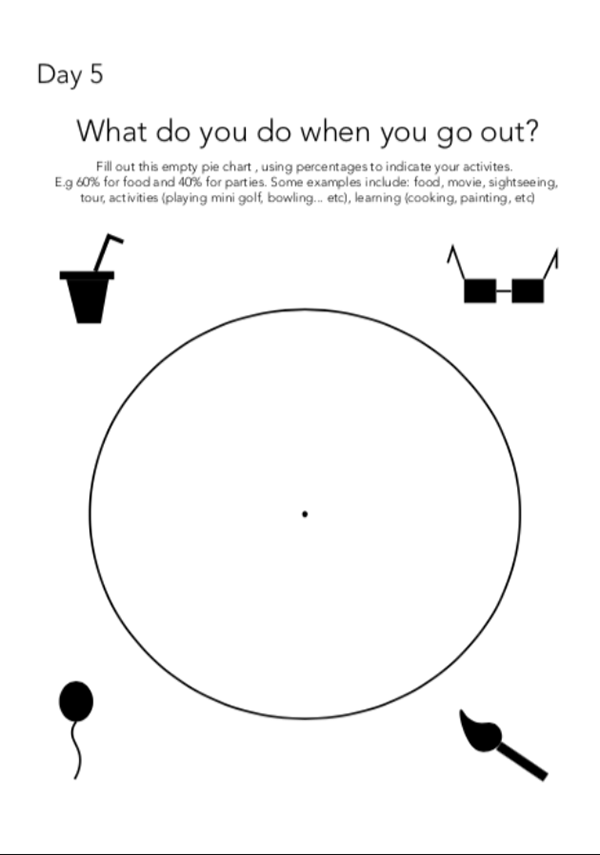
Our sensitising activities (above).
Example of our completed cognitive mapping activities.
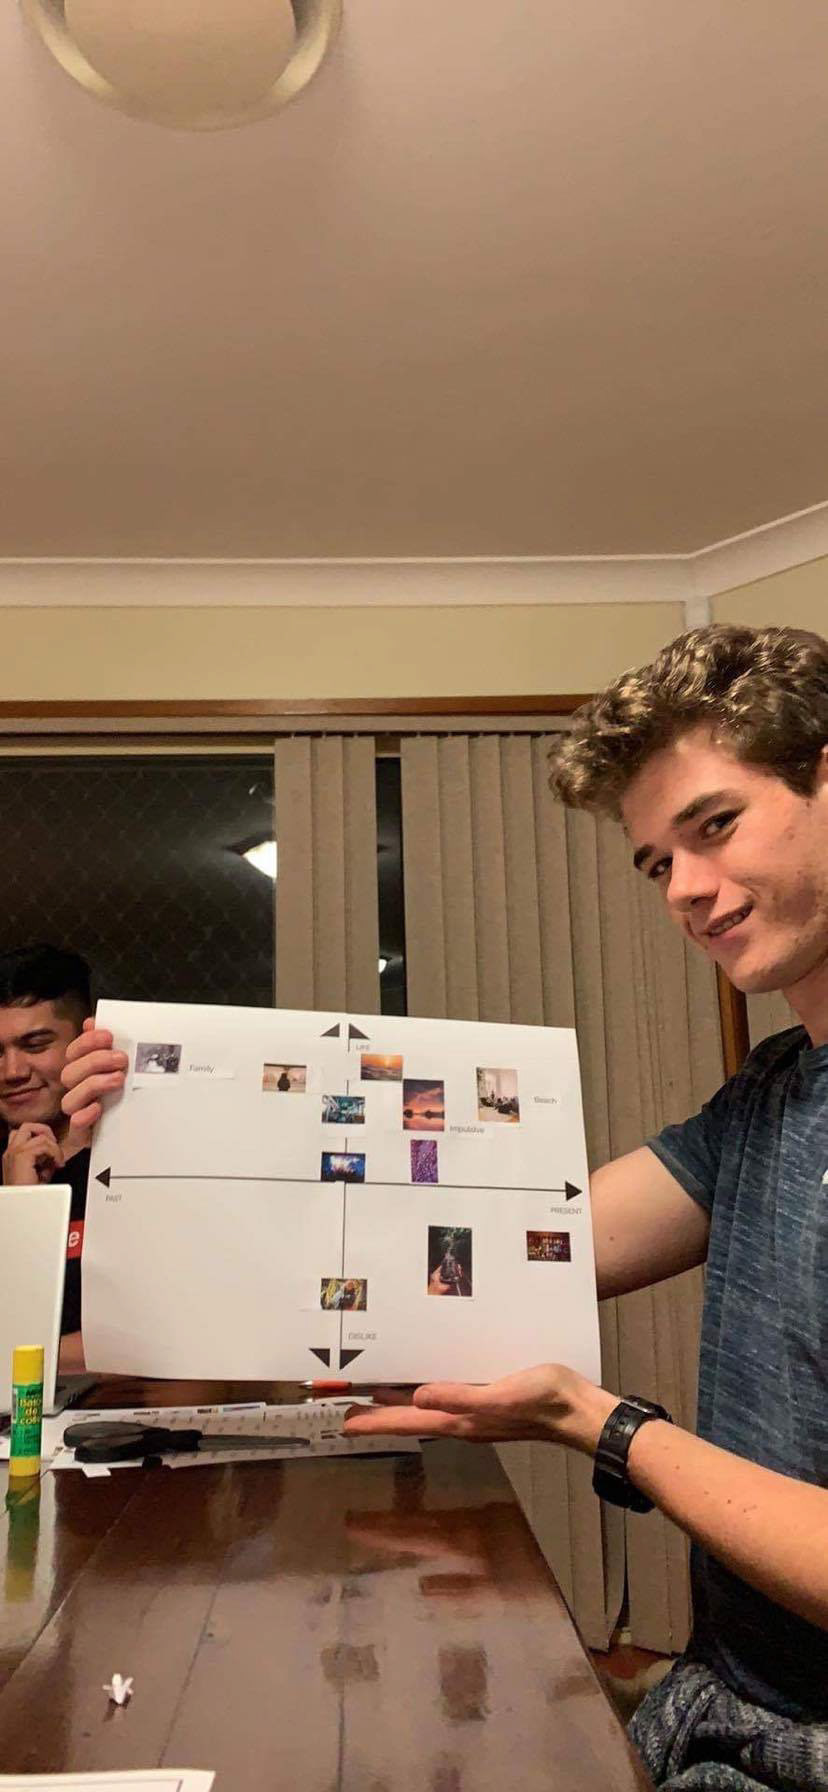
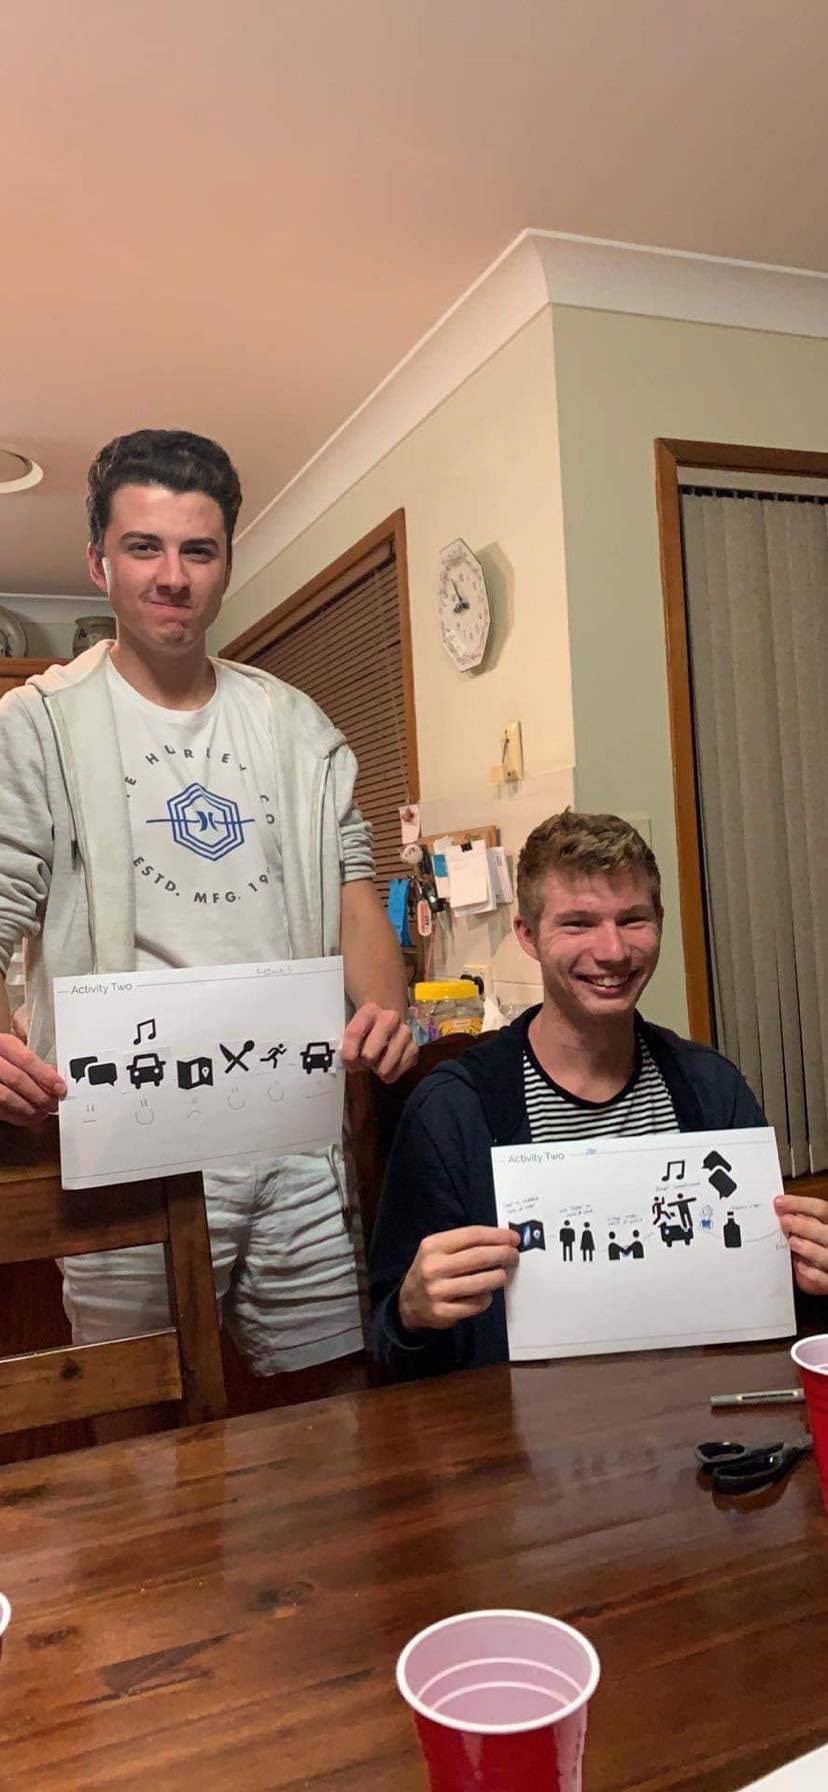
There were two activities, the first being the collage, and the second being a cognitive map. For the collage activity, our participants were tasked with creating a collage representing their feelings towards going out to the city in the past and present (the x-axis being past vs present, and the y-axis being how much they described a specific picture or word they associated with the city). The second activity tasked them with demonstrating a typical day at the city, and represent with smiles or frowns which parts they liked or disliked about the process.
There were a range of different stimuli items (pictures, icons and words), for both activities for our participants to have the ability to choose and describe their experiences more effectively.
In our discussions, we wanted to uncover the perspectives of our participants in regards to the following questions:
1. What makes an outing memorable?
2. Why do individuals go out/what influences them?
3. What is the process of an individual's day out in the city?
4. What are the problems with festivals?
5. How can we make festivals better?
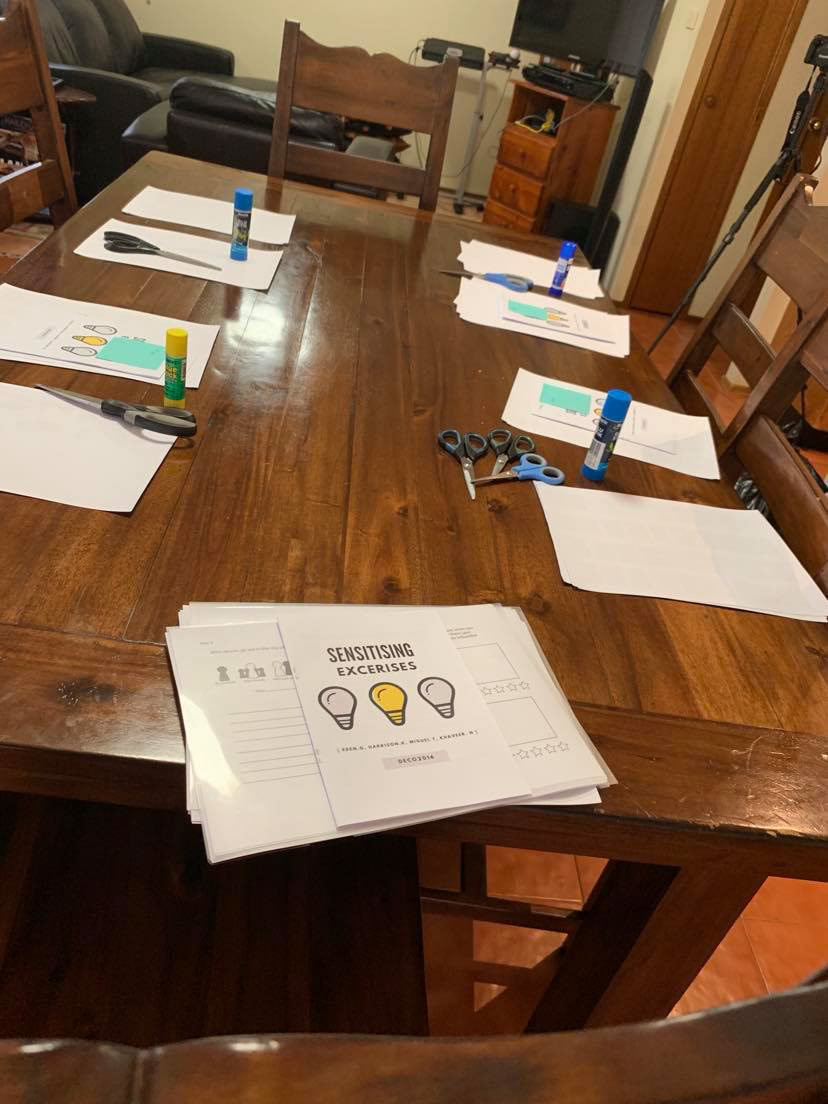
Before the session
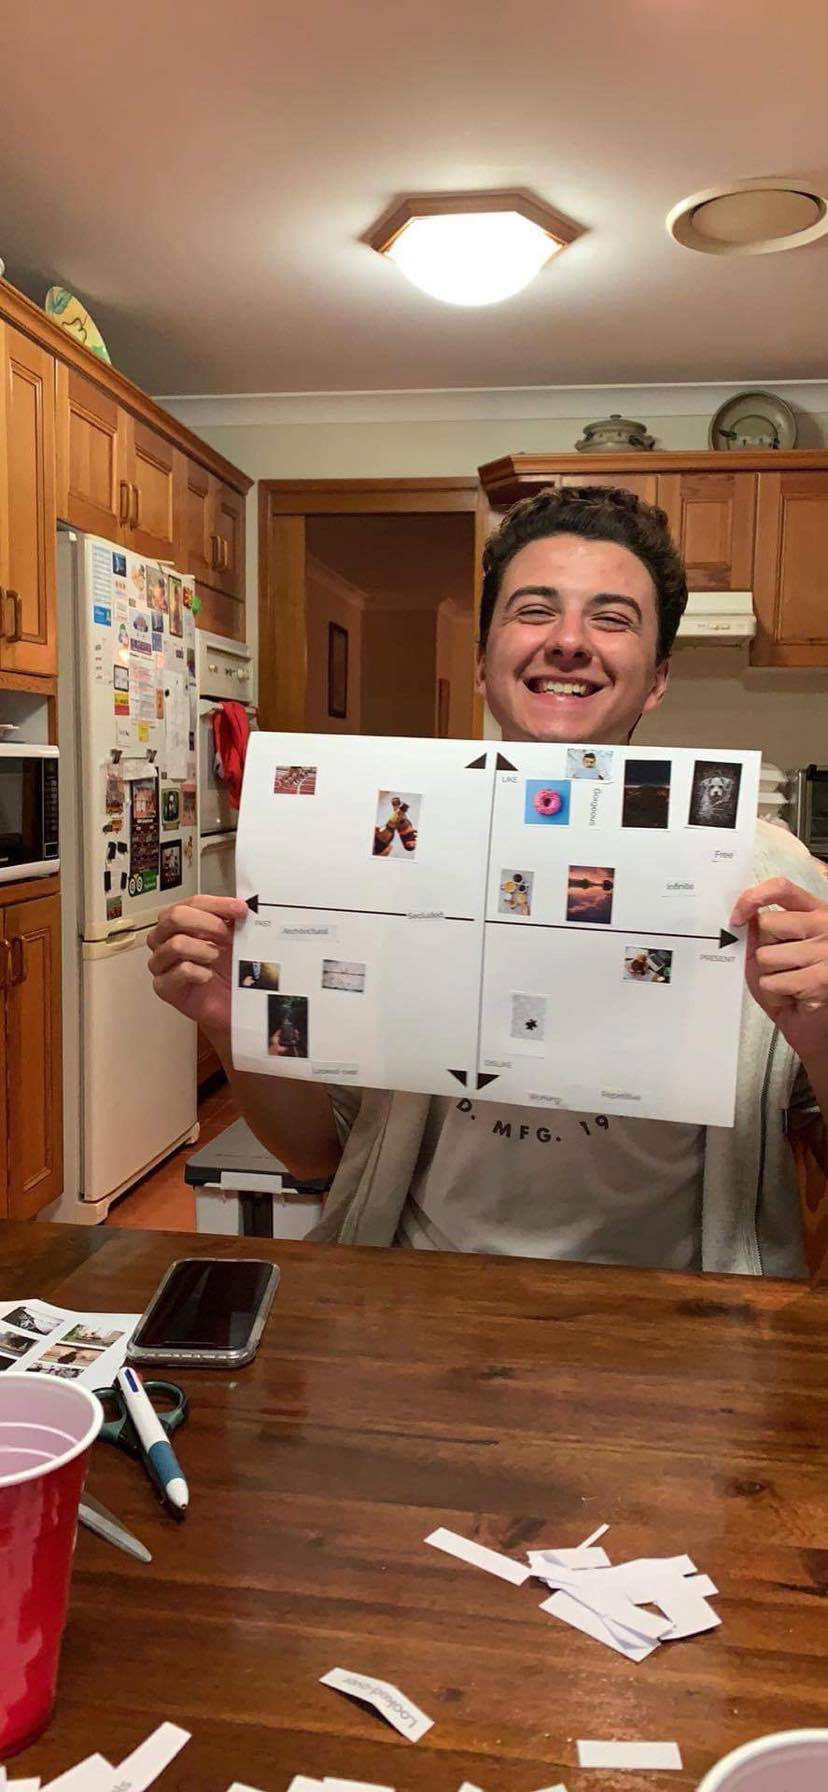
Activity One
Activity One
Activity Two
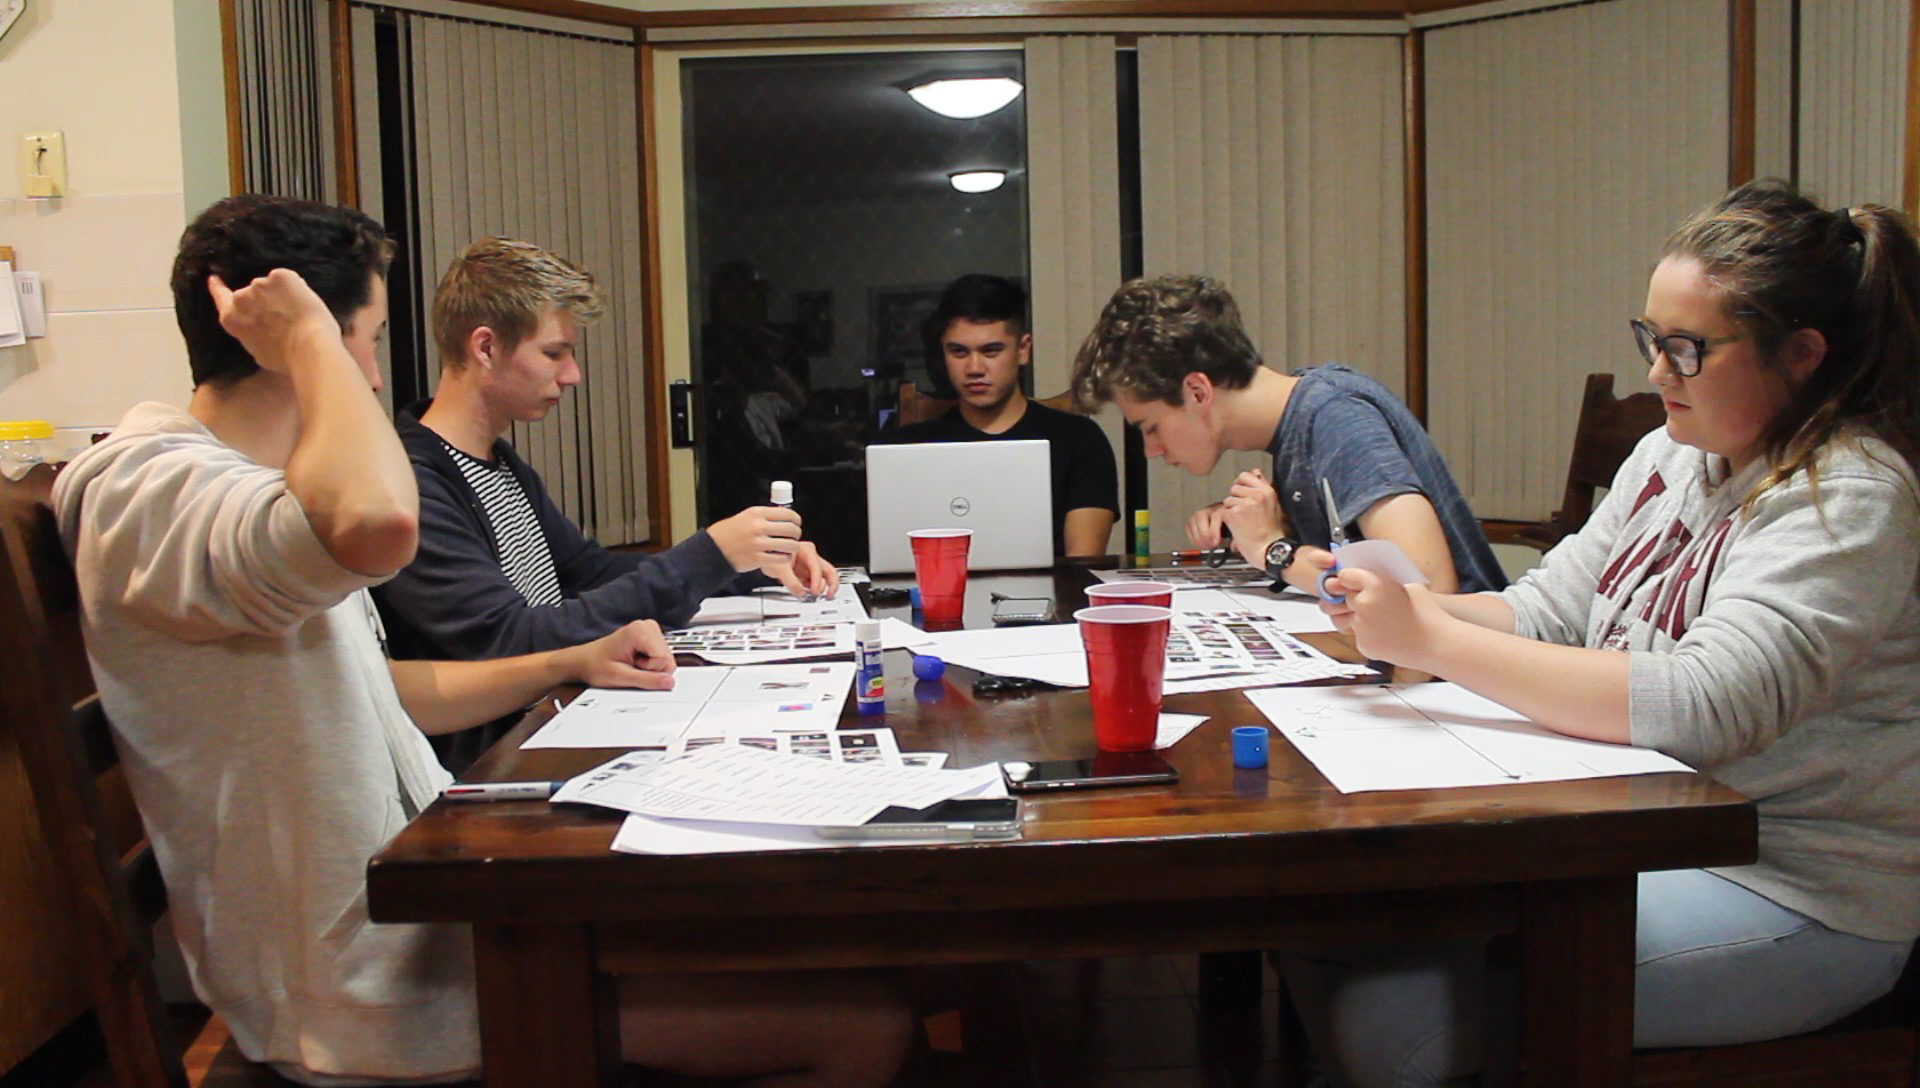
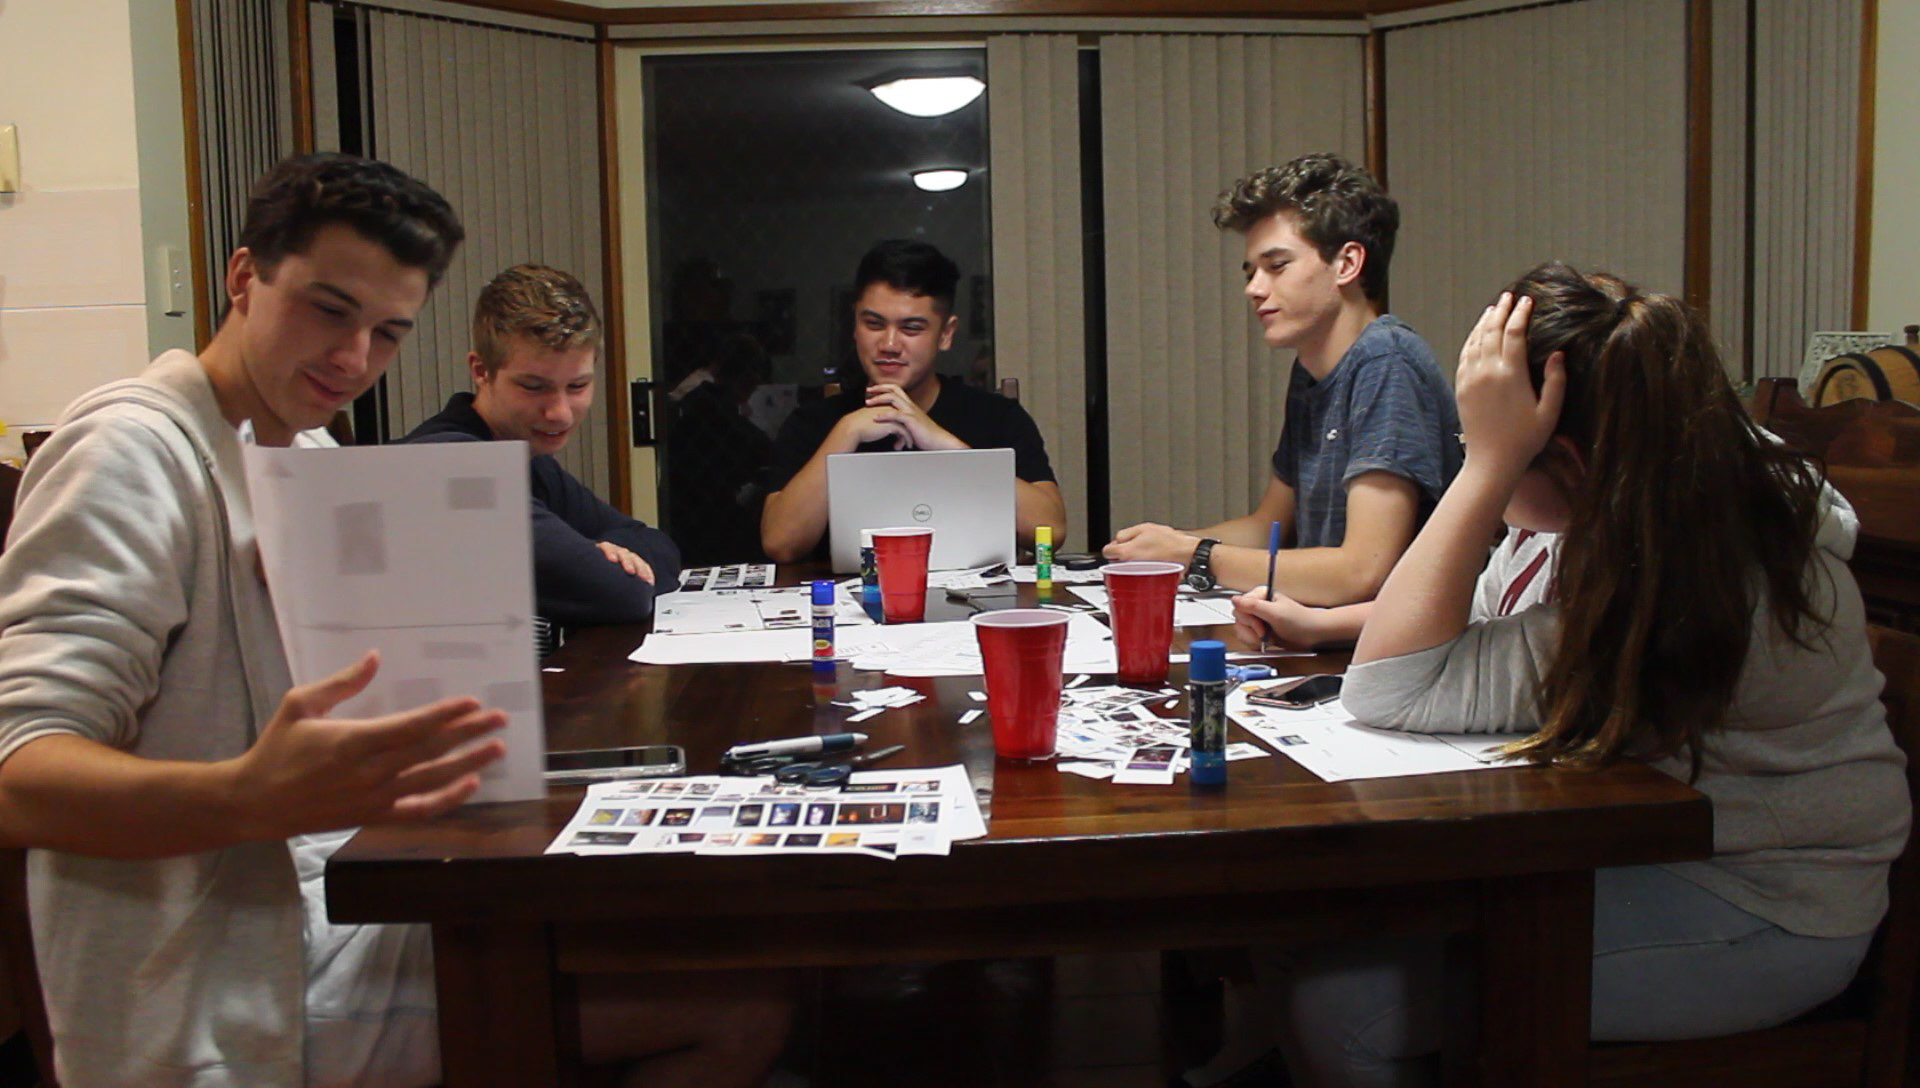
The generative session I conducted and transcribed (above).
Research Synthesis
The generative sessions allowed for our research participants to share their experiences with festivals. After the completion of the activties, a discussion followed. My group members & I facilitated each of the discussions, allowing for in depth conversations about their issues with festivals, and why they would be in the city in the first place. Within these sessions the participants could listen and contribute at any time, leading to fruitful discussion, where we could develop a consensus on Vivid and Sydney City's pain points and highlights.
After the generative sessions, we watched our footage, and made sure that we had a completed transcription of our sessions. Following this, we captured the main quotes from our participants and we created statement cards to categorise and conceptualise these insights. From this, twelve different themes arose, which we made into an infographic (featured below).
Statement Cards
Our research infographic
Developing the solution
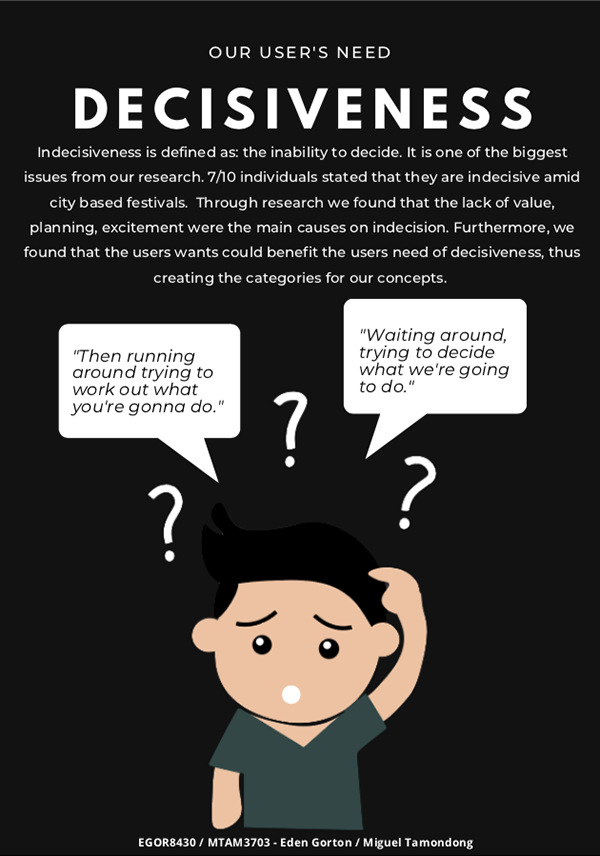
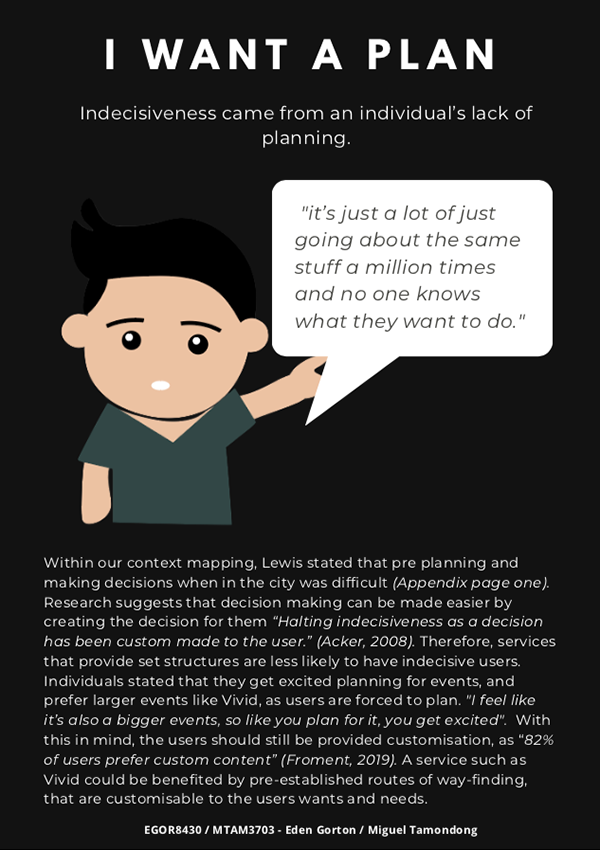
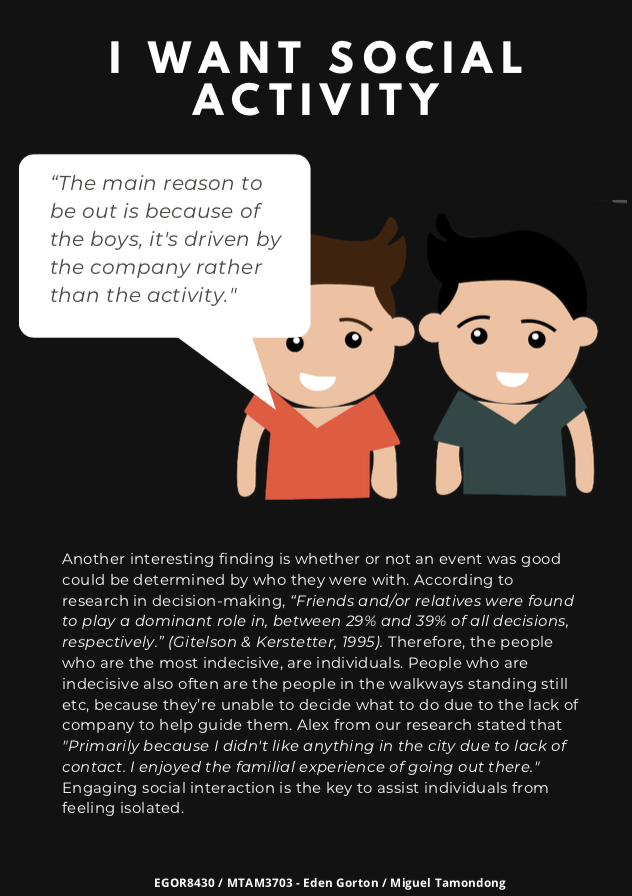
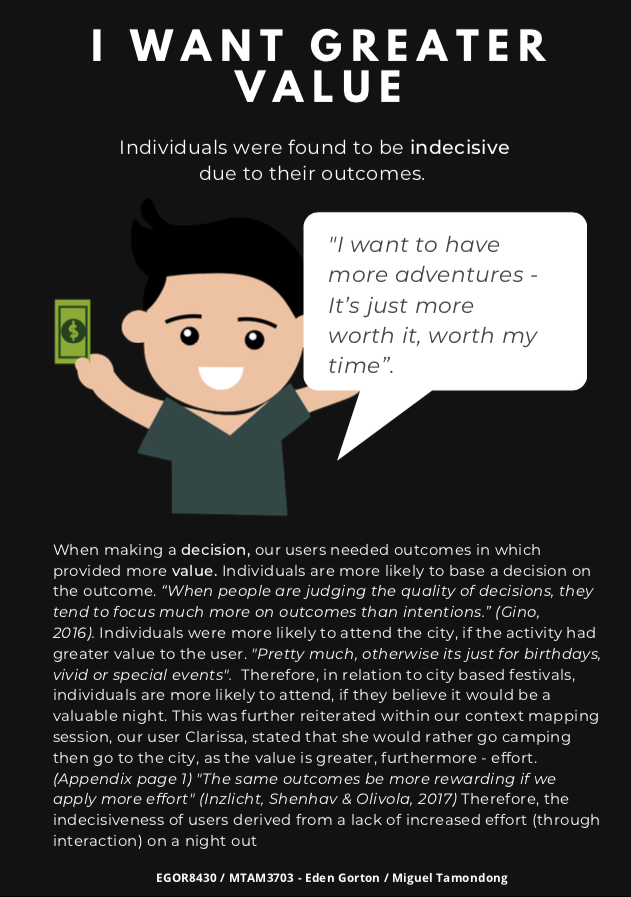
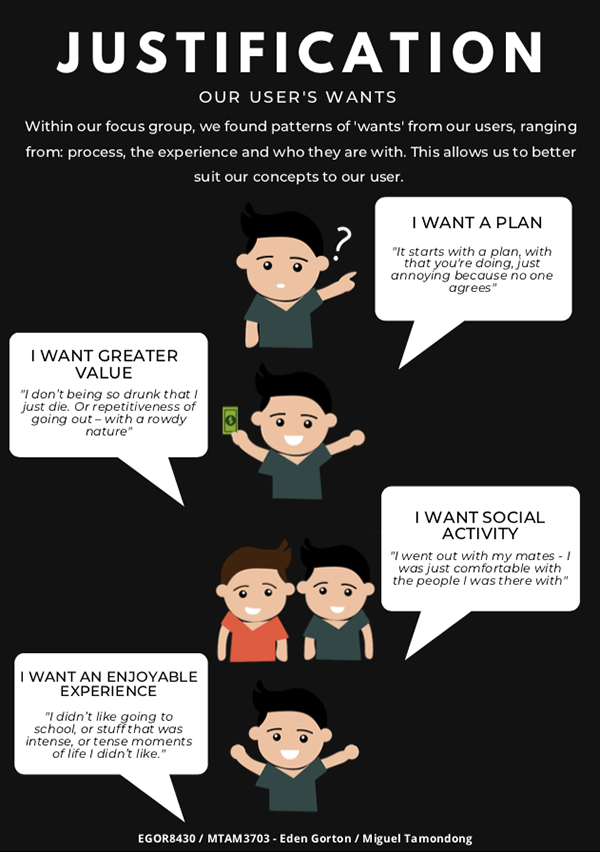
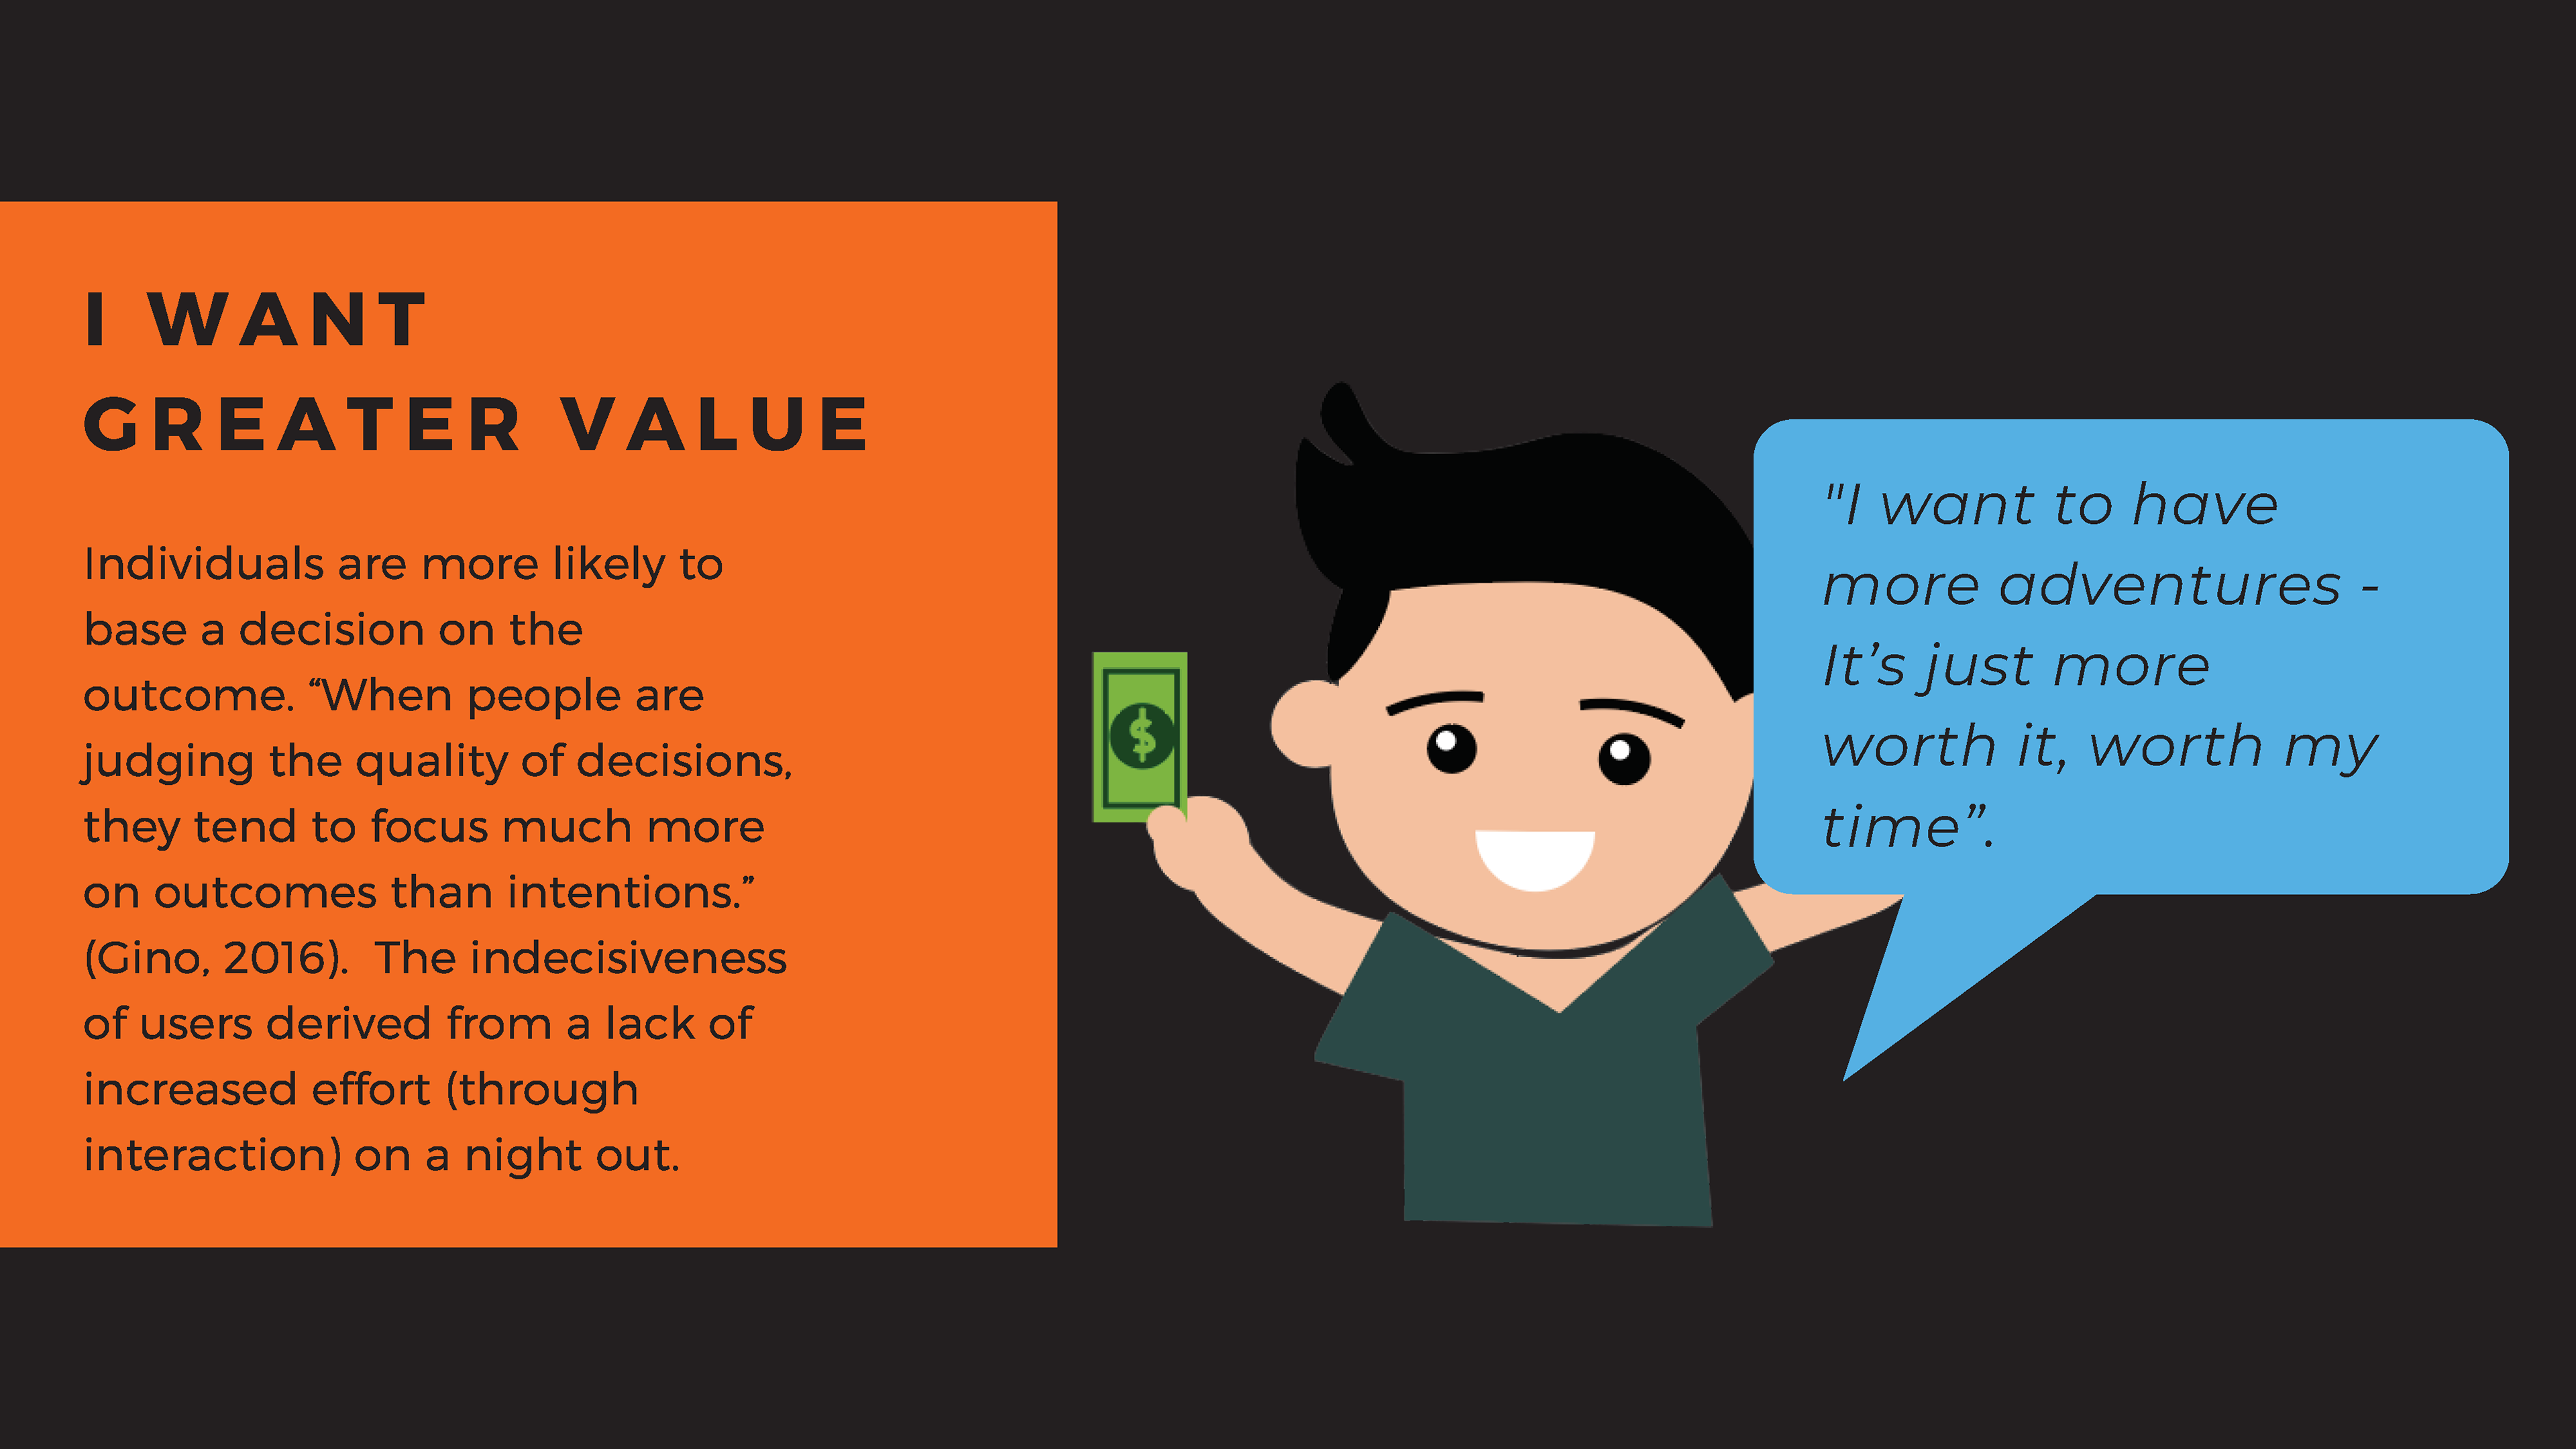
Following the creation of this infographic, our group of 4 split into pairs for the rest of this project. Eden and I decided that the main problems to address was our user's want for more planning, excitement, social activity and value whilst actually at Vivid, but in general they would also benefit from something to help them become more decisive.
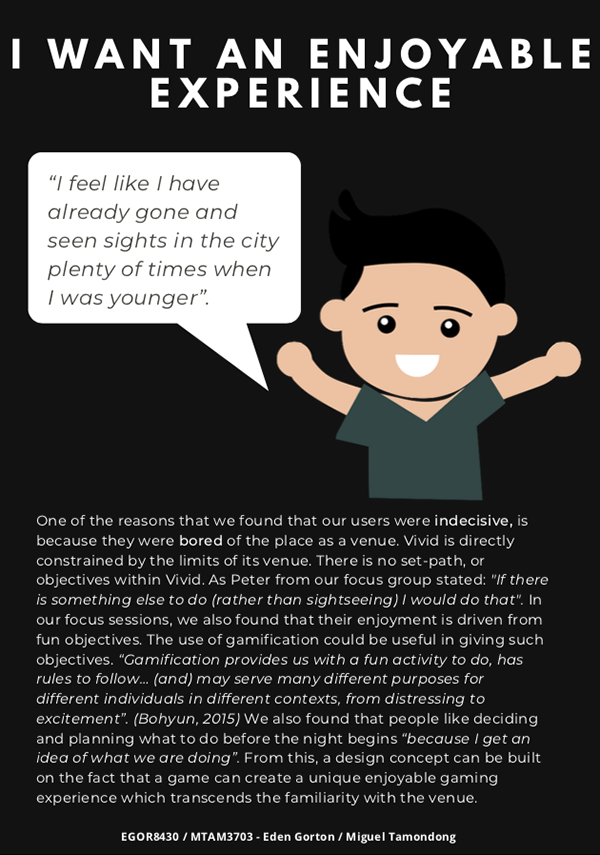
Our participants made it clear that Vivid is directly constrained by the limits of its venue. The 2.33 million people that it attracts do not fit in the small areas where installations are located. Most visitors are restricted to walking through seas of people who often do not know what to do as there is no set-path, or objectives within Vivid. At Vivid, it’s not hard to feel insignificant amongst the sea of people walking back and forth, especially if you are alone.
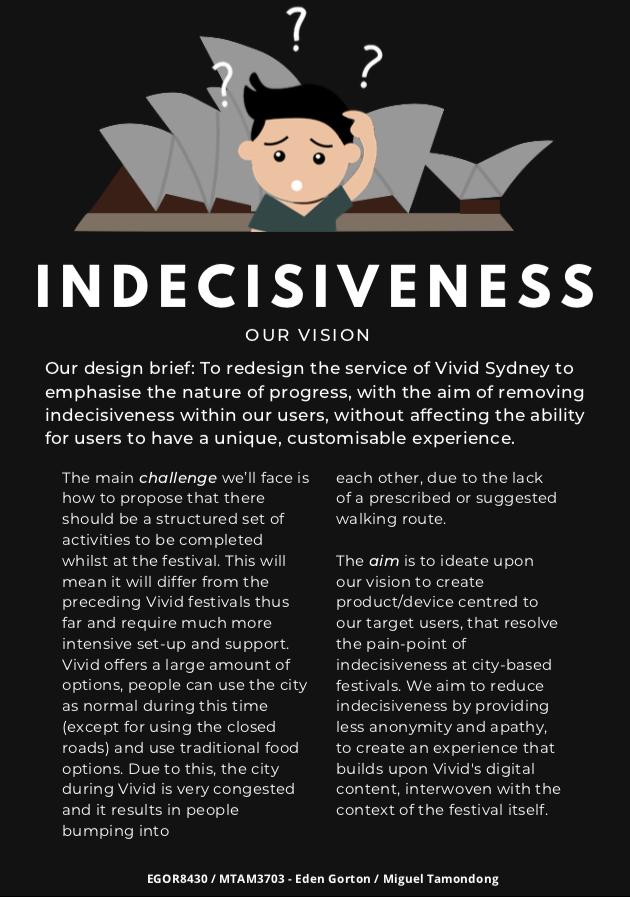
Eden & I myself developed two concepts each that could be involved with the development of a solution for these issues. I myself developed VividU and Vivid Together, (the storyboards are pictured below). From this, we gave ourself a design brief:
"To redesign the service of Vivid Sydney to emphasise the nature of progress, with the aim of removing indecisiveness within our users, without affecting the ability to for our users to have a unique, customisable experience."
"To redesign the service of Vivid Sydney to emphasise the nature of progress, with the aim of removing indecisiveness within our users, without affecting the ability to for our users to have a unique, customisable experience."
We developed a Harris Profile decision matrix to assess the viability of each solution based on a set of heustics that we developed. Our decision matrix was split into 6 criteria, split into 3 groups in order of importance. Feasibility and meeting needs were our two most important criteria both of which is critical for holistic human-centred design. Due to this, we multiplied the results of each group by 3 when multiplied the results when calculating totals. Our solution wasn’t as constrained as much by physical aspects or desirability in the same regard. We required a solution which was possible to implement and was digital, tangible and spatial whilst solving indecisiveness. From this we derived that finally, our best solution was an updated version of Project TRON with 135. Project TRON, was created to mainly address the user’s want of value and the need for decisiveness.
Storyboards for All 4 concepts
Storyboard for Secret Message and Hot & Cold
Decision Matrix for all 4 concepts
Final Concept
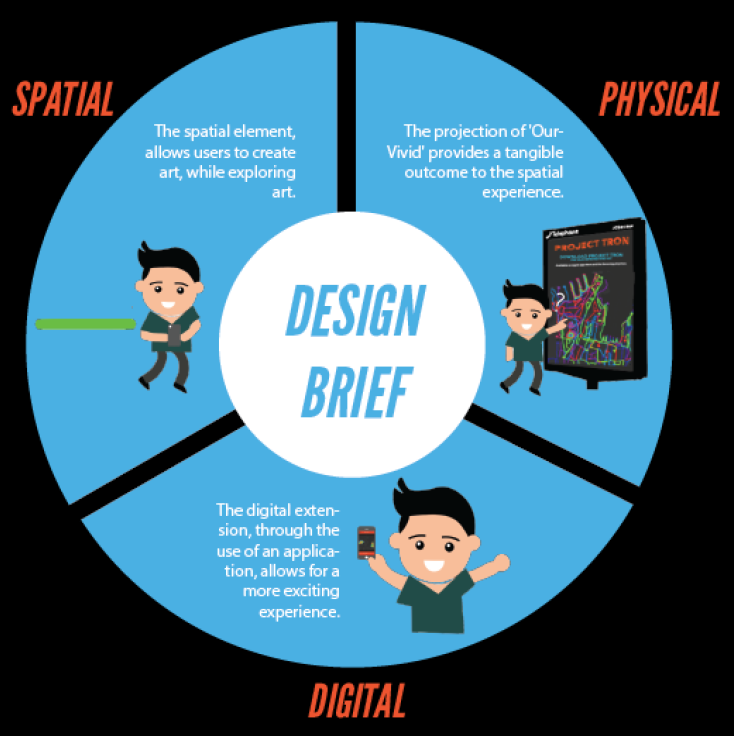
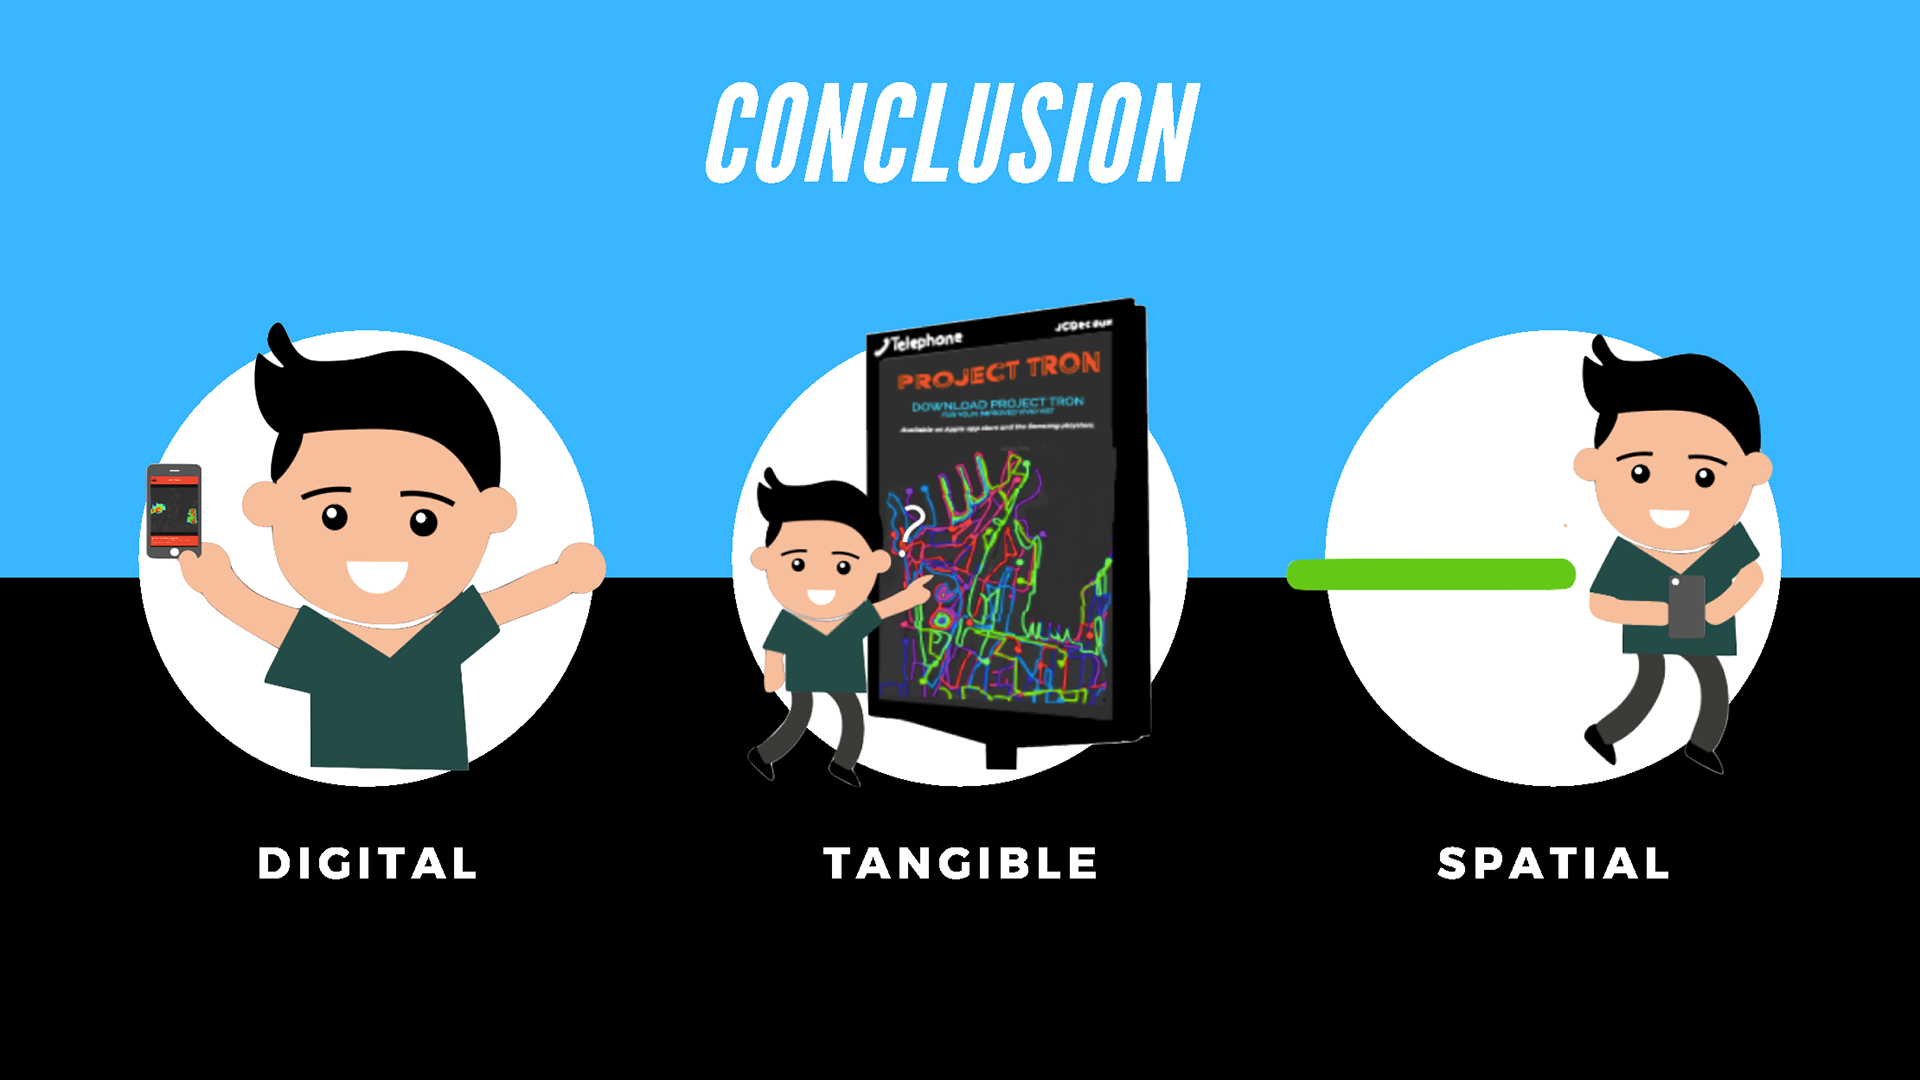
Project TRON is a digital, tangible and spatial experience that only builds on the act of
viewing installations and being in transit between them. The digital extension (in the
form of an application) allows for a more exciting, thus, valuable experience. The
projection of 'OurVivid' provides a tangible outcome to the spatial experience. The
experience that Project TRON provides is tailored specifically for Vivid, being based on
aesthetics and the process of Vivid. The user solves their own indecisiveness, by creating
art while exploring art.
Project TRON is an application-based design, intended to address indecisiveness. The 4 wants of our users are: Social Activity, Enjoyment, Value and Planning. Project TRON was created based off the user's want of value and their need of 'decisiveness'. It's a gamified version of way-finding. The user walks around Vivid, and creates their 'trail', which will contibute to a mass artwork of all users.
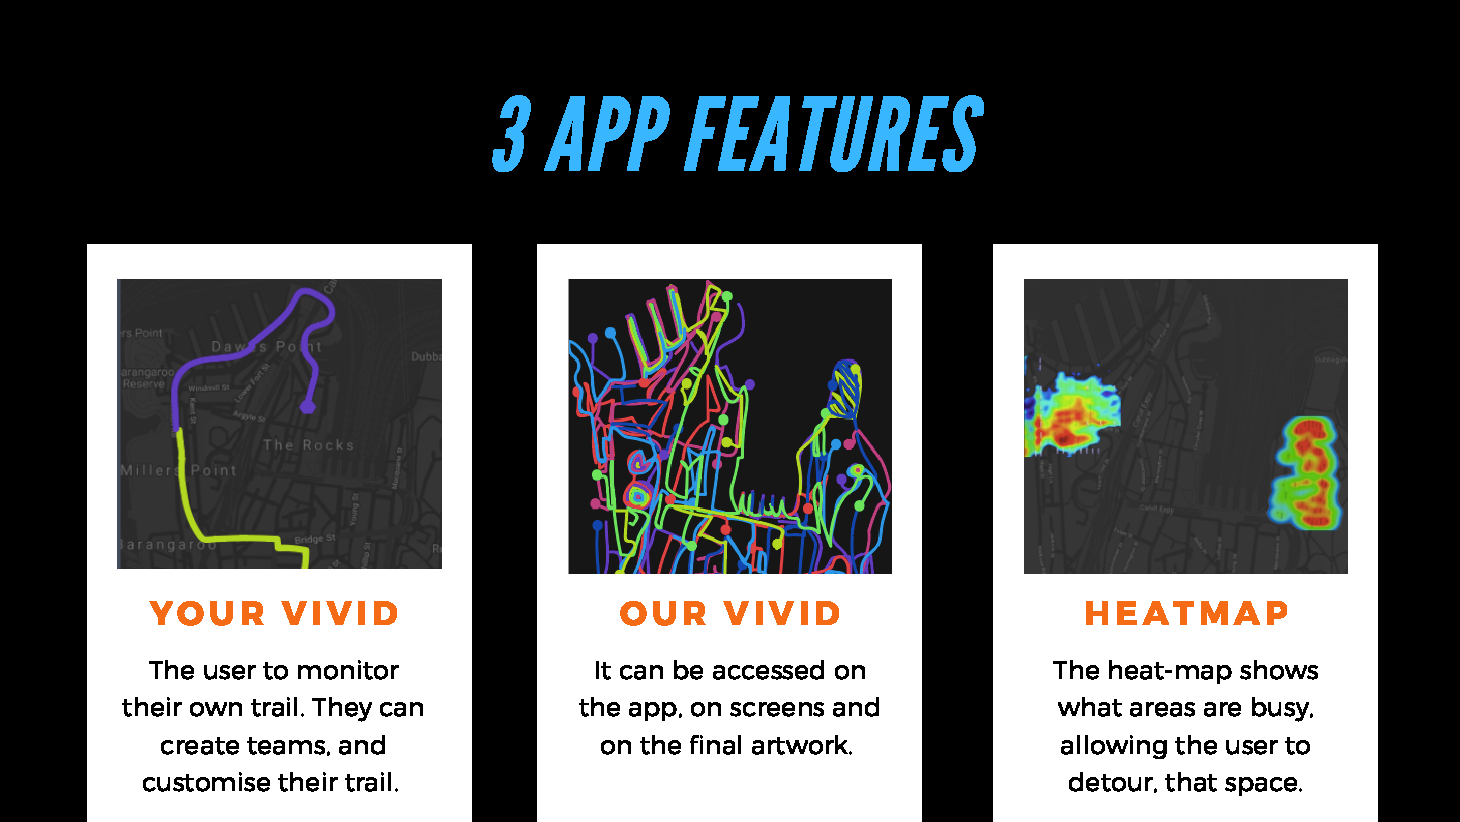
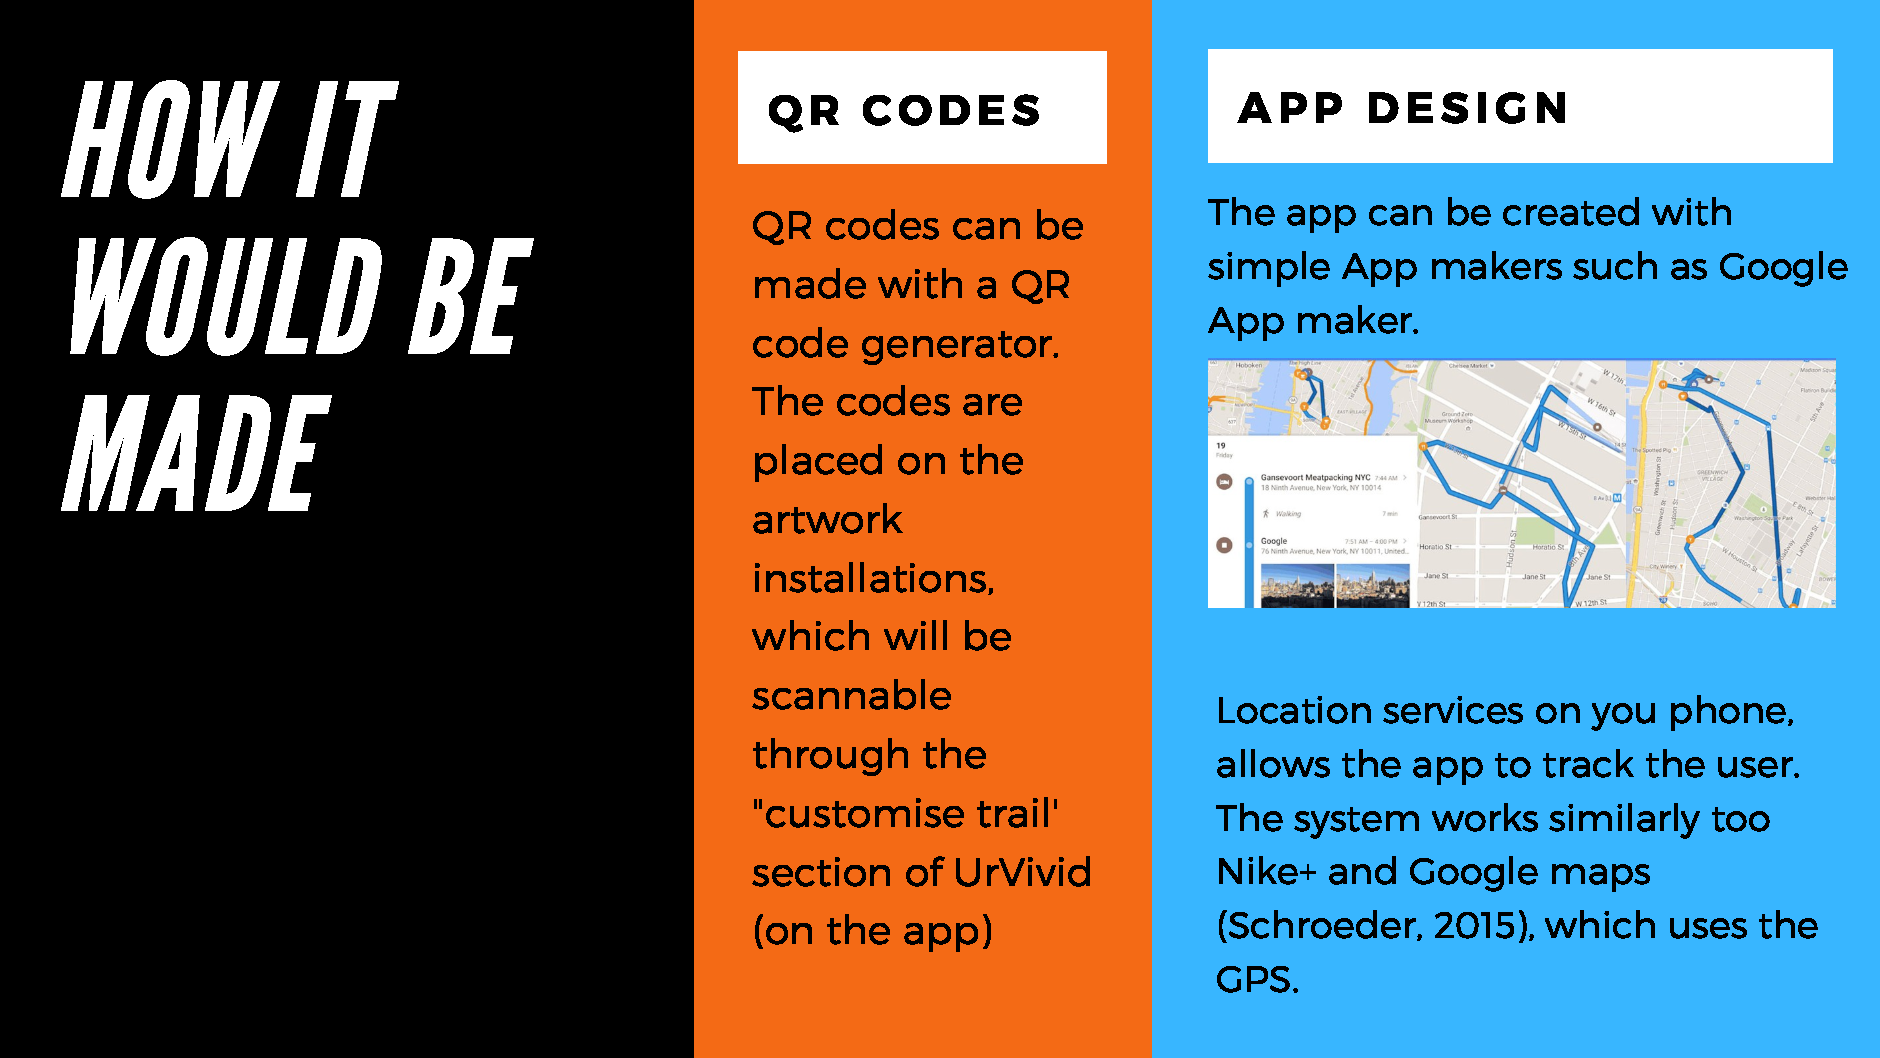
Project TRON comprises of 3 main functions. The first is 'UrVivid' which tracks the user’s movements around the city/Vivid space, the movements creating an artistic projection of where they have walked in the form of a colourful trail. Stroke and colour can be unlocked by scanning QR codes on the side of Vivid installations. All user movement will be calibrated and projected in real time on its own installation called
‘OurVivid’, providing a standout option for to do whilst at Vivid. ‘Heatmap’ is available on user’s phones to display which installations have the most people present, so that they can adjust their route around Vivid accordingly.
‘OurVivid’, providing a standout option for to do whilst at Vivid. ‘Heatmap’ is available on user’s phones to display which installations have the most people present, so that they can adjust their route around Vivid accordingly.
Design Approaches
Observational Learning
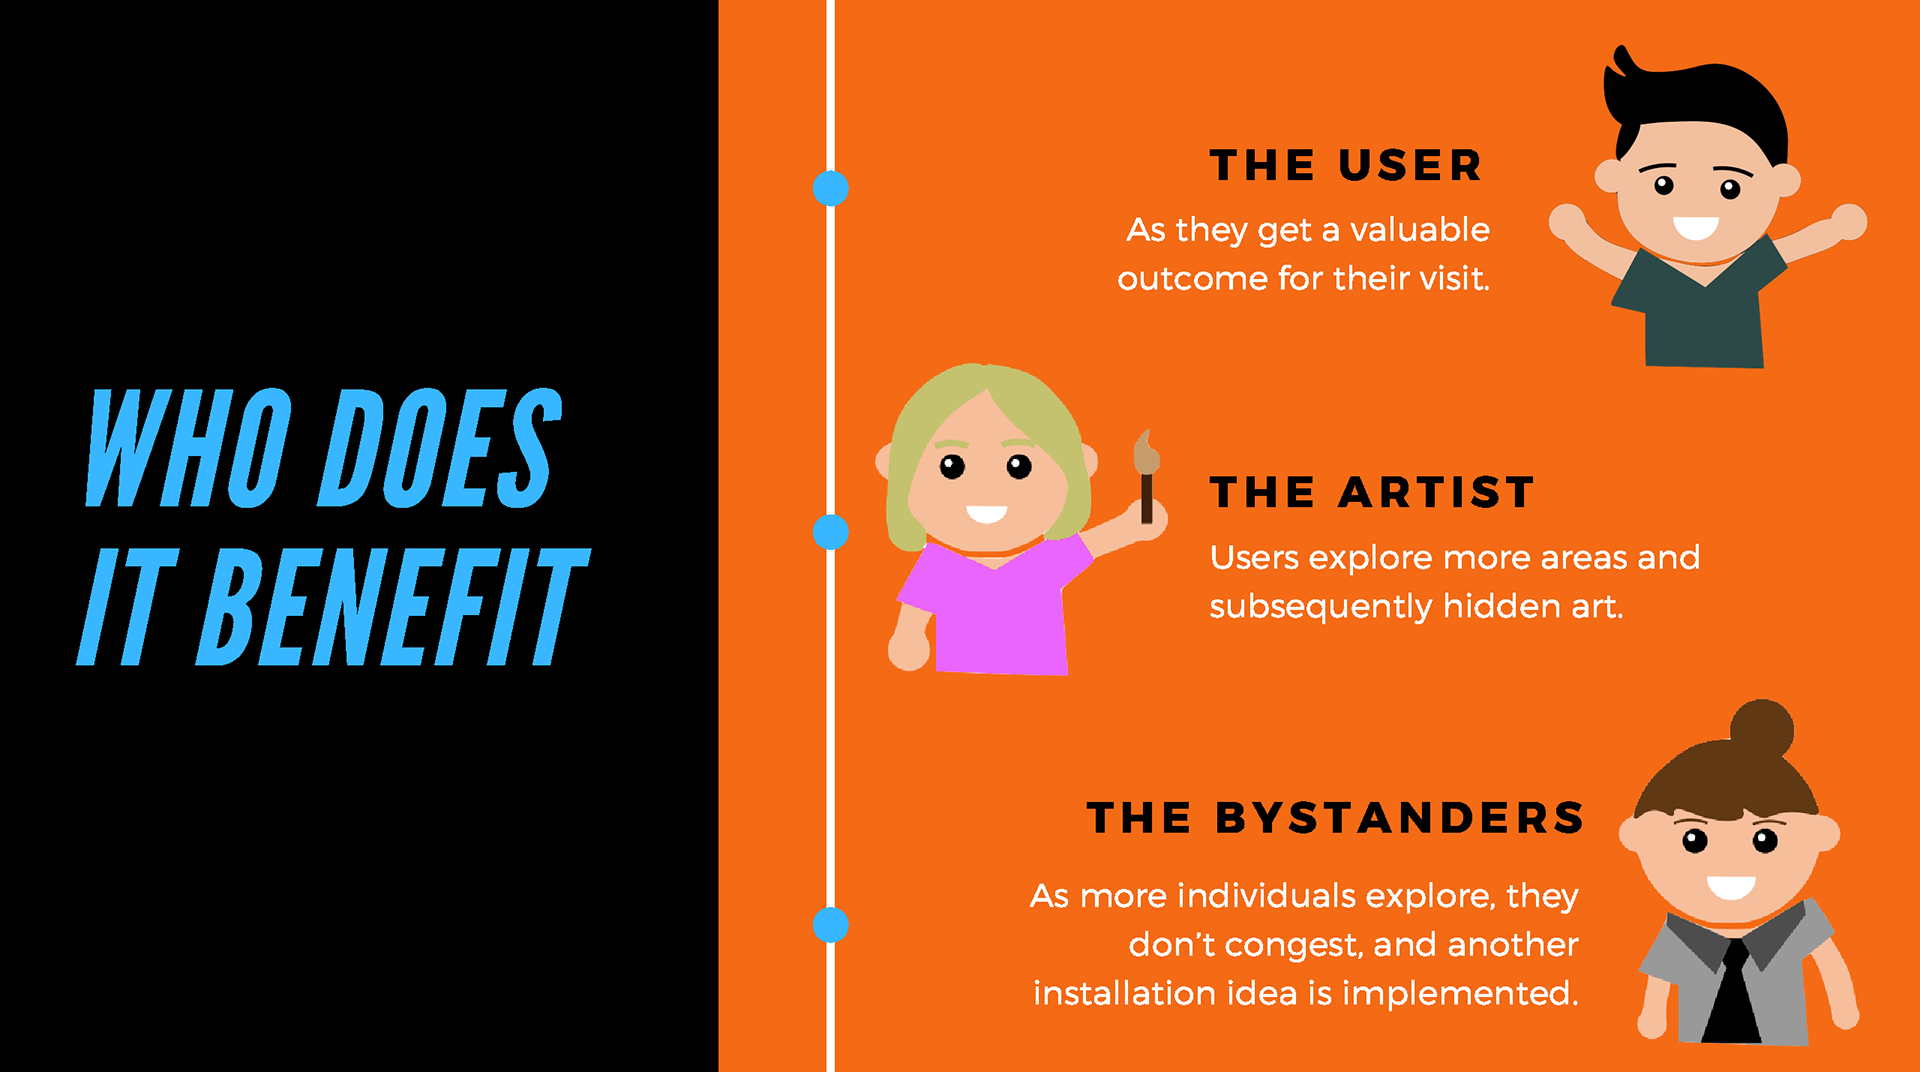
Project TRON solves the problem of indecisiveness through observational learning. A user watches other people’s trails, then replicates behaviour. ‘OurVivid’ being placed on a screen increases visibility towards Project TRON. This increases traffic, allowing more users to utilise the application and build awareness for it. This in turn results in the development of strong customer relationships by showing the worthwhile outcome of the product.
Gamification
Project TRON was designed to make the activity of walking and wayfinding more enjoyable. The bright colours and trails were chosen to make it imitate ‘TRON’ (the game involving light trails which our solution is based on). The implementation of gamification influences user’s perception of value towards this solution, through an increase of enjoyment which can be obtained with little effort. In this case Project TRON results in enjoyment from our
users, making simple tasks such as walking from installations more exciting.
users, making simple tasks such as walking from installations more exciting.
Emotional Design
Due to the design solution being focused towards solving indecisiveness concerning the user’s want of added value, emotional design seemed like the appropriate process to
undertake. Within the visceral and behavioural stage of emotional design, we wanted the initial reaction and use of the product to have a perceived sense of quality, through the
engagement of a multisensory experience. The user in reflection should have accomplished our intended goals from the product and therefore added value to the user.
Holistic Design Analysis
Holistic design is split up into IT capabilities, business needs and user needs. Through user research, evident within our design brief, we implemented divergent thinking by ideating on the wants and needs of our users. We began converging due to IT capabilities (what
technology is realistic) and business needs (the outcome of our decision
matrix, which solution assists the redesign of Vivid most effectively).
technology is realistic) and business needs (the outcome of our decision
matrix, which solution assists the redesign of Vivid most effectively).