Introduction
Does height impact your overall success in the NBA? The NBA is a professional basketbal league formed in the United States in 1949. Since then, there have been a multitude of changes to rules, the factors which influence player success are constantly changing. However, one factor that has stayed constant is the average height of an NBA player. Between the years of 1982 and 2016, the average height has stayed consistently between 6’6” and 6’7”. This is significant because, for comparison, the average height of an American male over the same period has remained at around 5’9”. With a 9” - 10” height difference between the average population and NBA players, it’s clear that height has something to do with being a successful enough basketball player to play in the NBA. We’re interested in the extent to which this trend, whereby being taller you are more likely to succeed, persists within the microcosmic population of players in the NBA. Overall, how a player’s height correlates to their success in the NBA, is what we are looking to investigate.
Measuring the overall success of a player can be done in a multitude of ways, with the overall importance of any particular measure subjective to opinion. However, the most widely used statistical summary measure in the NBA is the PER. The PER was developed by John Hollinger and uses all the NBA’s gameplay-based statistics to boil down a player’s per-minute performance rating to one number. Accurate, modern and complete measures from which to determine PER have been recorded for all NBA players since 1980. Some other measures which can signify a player’s success include longevity, minutes played, trophies won and money earned. Overall, an array of success indicators are needed to provide a holistic view of a player’s success, but each also individually indicates an independent form of success.
We as a team conducted a variety of exploratory data analysis (EDA) such as box and whisker plots and 5 number summaries to compare how the amount of playing time (i.e. minutes or even entire seasons played) can impact the reliability of measuring individual Player Efficiency Ratings. This investigation can be seen below:
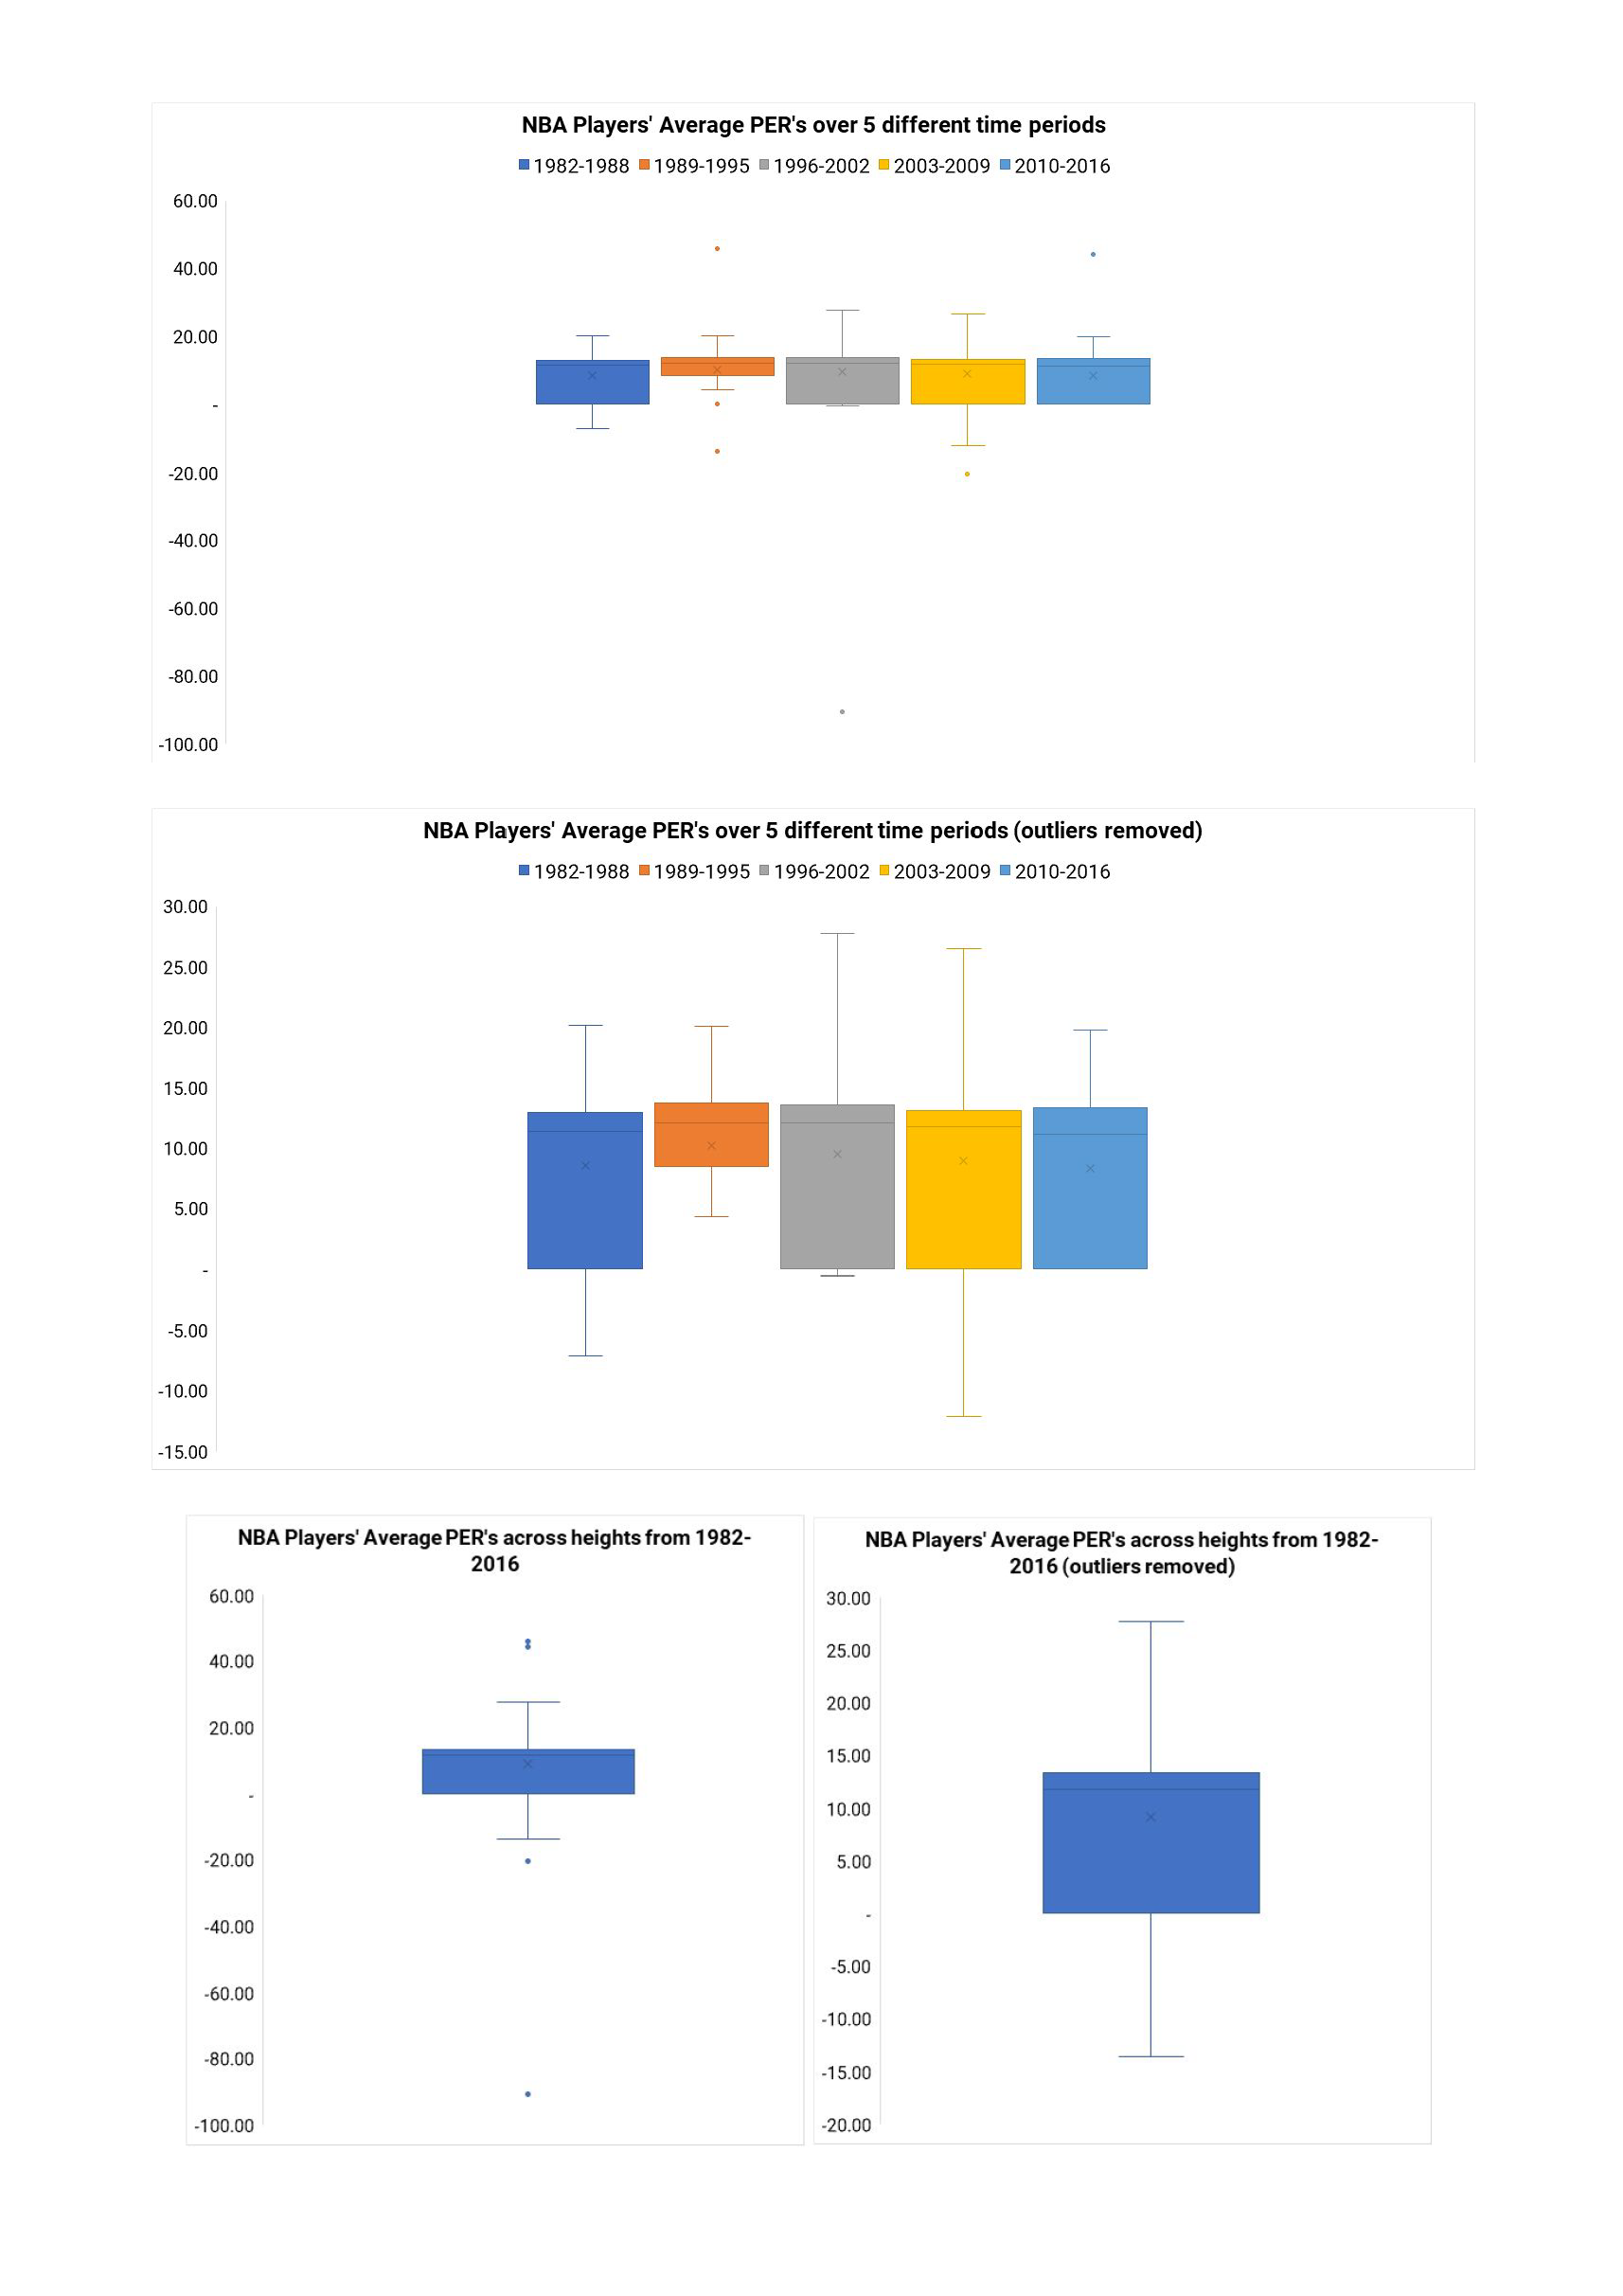
Exploratory Data Analysis (EDA) comparing PER to amount of seasons played.
In conclusion, comparing the amount of seasons played by each height division was the most effective way to create an even comparison. This is demonstrated in the visualisation below:
Visualisation Comparing the average PER for each height class vs the amount of seasons played.